The internet is integral to almost everything we do these days and needing our spreadsheets to interact with it is becoming more and more important. Whether you need to automatically download and import data files from a website, pull in search results or automatically post to a forum, Excel provides the macro developer with the ability to do all of these things. It does this by creating a 'hidden' Internet Explorer window, and through the use of Visual Basic for Applications (VBA), allows the macro to do almost everything a person can do but behind the scenes, and at the click of a button.
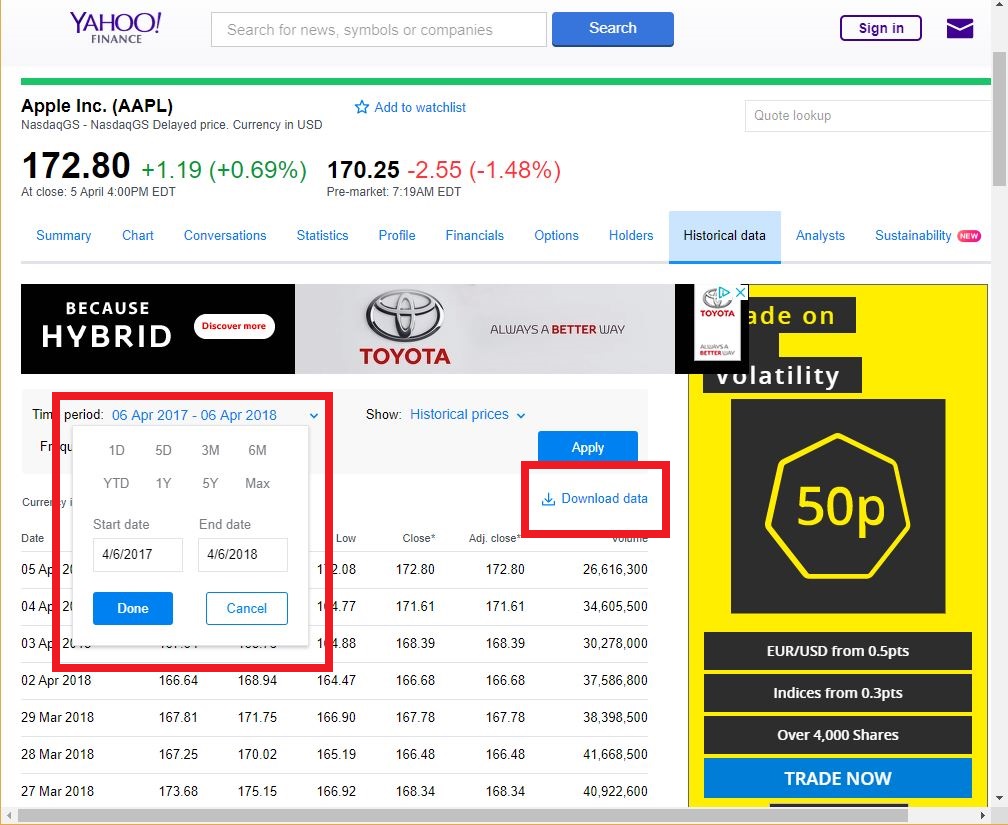
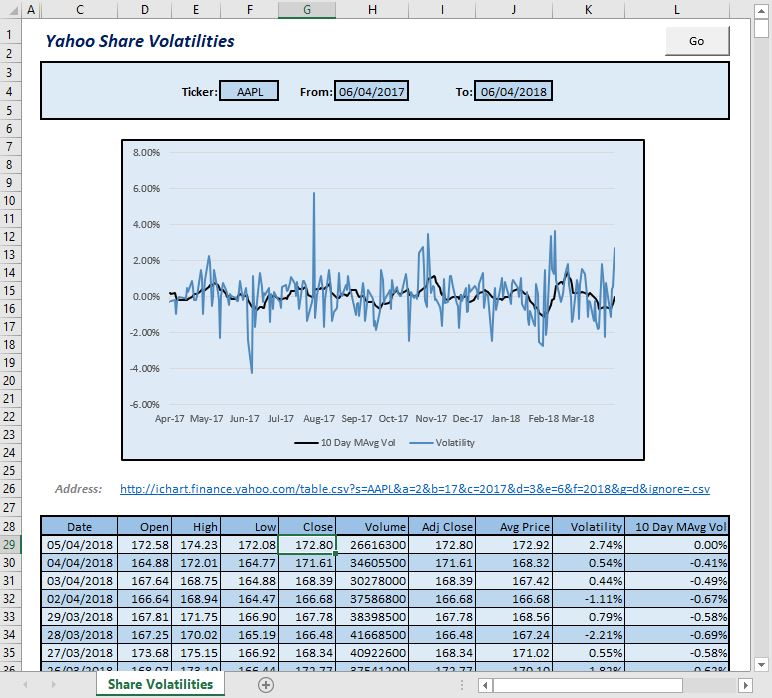
A client came with a brief to calculate 10 day average share price volatilities for a chosen ticker (e.g. 'AAPL' for Apple Inc.) over the course of a year. In order to do this, share prices needed to be fetched from Yahoo Finance by simulating a search on the website for historical prices and then clicking the 'download link' (see website screenshot). Of course, in the resulting spreadsheet shown below, all the user saw after clicking the button was the spreadsheet table and the chart being refreshed a couple of seconds later.

Yahoo Finance historical share prices page

Share Volatilities using Yahoo Finance prices
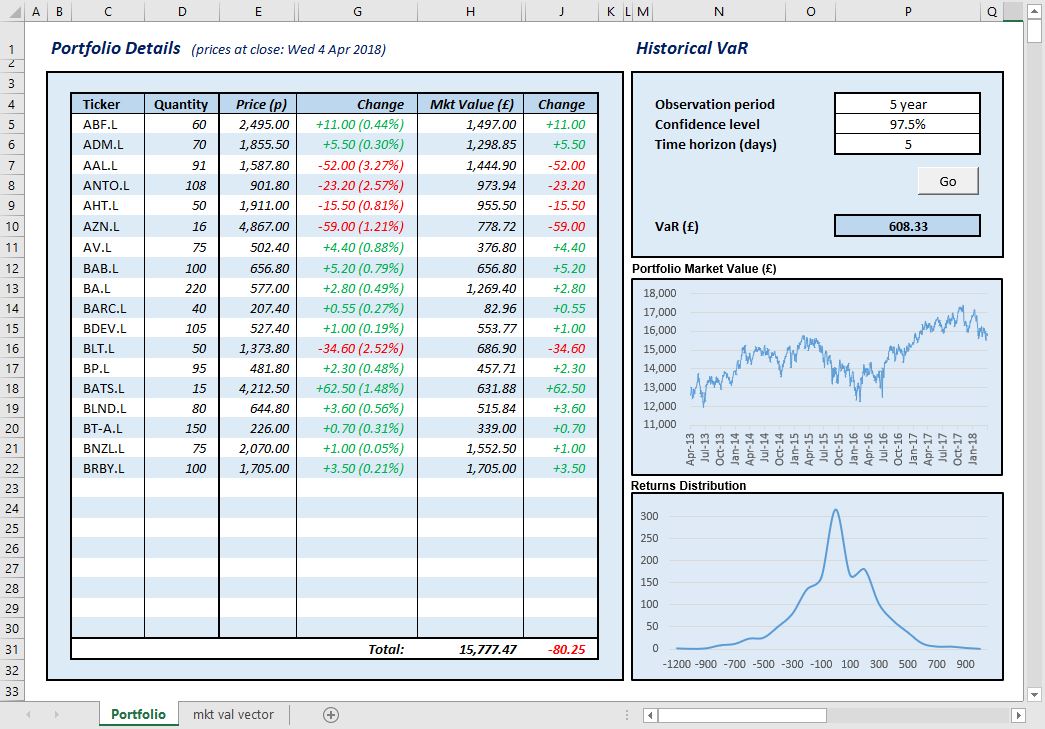
The above is only a very simple example of what can be possible with something like Yahoo's historical share price web page. A more complex example is the historical value-at-risk (VaR) calculator shown below.
The VaR measure of a portfolio answers the question: 'ignoring the worst n% of the time, how much money could I stand to lose over a certain number of days?'. There are various ways of calculating VaR, one of which is to use historical prices. It is worth noting that there are other more preferable ways from a risk management standpoint, but many large financial institutions continue to calculate a daily historical VaR for their own and their clients' portfolios as it is relatively speaking quite straightforward.

Historical VaR and market value calculation using Yahoo Finance prices
In this spreadsheet, the user specifies a portfolio of simple UK-listed shares by entering a list of tickers and share quantities, and then clicks 'Go'.
Behind the scenes the macro code then:
A 3rd hidden sheet also works out the market value of the portfolio each day by multiplying the daily price by the quantity of each share, and then adding this up for the whole portfolio. This is shown in the first chart.
The second chart shows the distribution of gains/losses for the portfolio. Note that the distribution centres on zero, indicating that on most days the portfolio gains or loses very little.

Reporting progress as prices are loaded from Yahoo.
If you would like to discuss a potential project, I offer a free 30 minute telephone consultation.
If you are interested, you can request one here.